Jet fuel is the largest or second-largest line item for most carriers, roughly 25 to 30 percent of airline operating cost in 2024 and 2025 (IATA). The document that governs that spend is the fuel ticket, and somewhere between the wing and the ledger a significant share of its data is still keyed or re-keyed by hand.
This edition replaces three earlier Logicraft papers on the subject and adds what they did not have: a measurement. Every figure in it is tagged Measured, Benchmarked or Modeled, and an evidence register gives the status of each one. Get the complete white paper. We'll email it to your work address.
How the figures are counted. A wrong value means the ticket named a different aircraft, flight or destination from its posted record, had its date corrected, was re-issued by the source with materially changed values, or carried no quantity. A required field left blank means no destination, flight number or registration, or no net volume on a feed that reports one. The 16.5 percent is a floor: blank fields are only visible from September 15, 2026. No human touch means the ticket reached the ledger with no date pin, no flight or tail pin, no field edit and no override by a person.
The error is cheap. The cascade is not.
A mis-keyed tail, a dropped digit in a meter reading or gallons confused with litres costs almost nothing at the moment it is typed. It becomes expensive as it moves: into an invoice, through a three-way match that fails or, worse, matches wrongly, into a dispute between two or three organisations, into a fuel tax filing, and finally into an auditor's sample months later. The paper follows the old 1·10·100 rule of data quality: about one to prevent an error at the source, ten to correct it downstream, a hundred when it is left to fail.
| Stage | What happens | Cost added |
|---|---|---|
| Capture | A wrong quantity, tail or unit enters the system | Latent; nothing visible yet |
| Invoice | The invoice is built on the wrong value | The wrong amount is now in the payment stream |
| Three-way match | Ticket, invoice and contract price fail to reconcile, or match wrongly | Investigation; a payment held or wrongly released |
| Dispute or leakage | Credits, rebills and re-reconciliation, or an overpayment that settles silently | Staff hours at several parties, or margin lost for good |
| Tax and audit | Fuel tax and into-plane fees computed on the wrong volume or location | Under- or over-remittance, penalties, remediation |
What the field actually shows
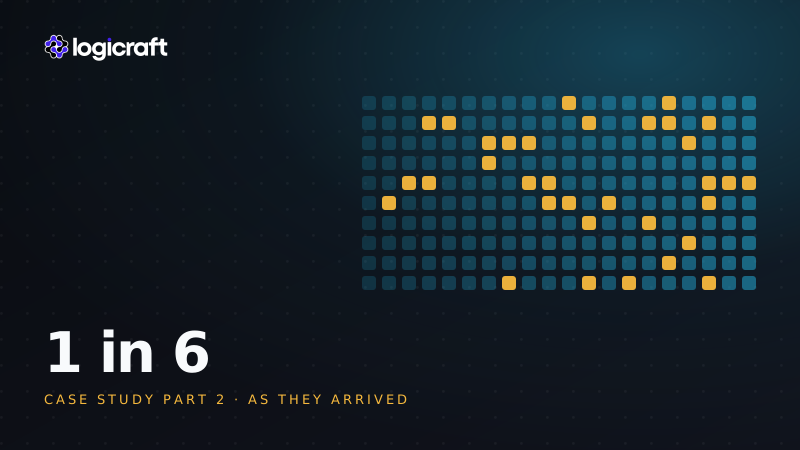
The earlier editions argued the case from public benchmarks: human data entry runs at a 1 to 5 percent base error rate, and manual invoice processing settles near 2 percent. This edition adds a direct measurement. Between July 1 and October 31, 2026, Logicraft processed 23,207 live fuel tickets for airline customers at 50 stations on FuelDeck™ and compared every ticket, as written, with the fact established after validation. About one in six arrived with a wrong value or a required field left blank. Every one of those tickets arrived as an Excel, PDF or CSV file from a handler portal, feed or email, not as handwriting, which is the point: the errors start in the files an operation already receives.
The detail is in Part 2 of the case study. The white paper puts it beside the benchmarks and asks what it costs.
What a "clean" 2 percent costs
To keep the cost concrete the paper follows one illustrative operation: a mid-size into-plane fueling and accounts-payable team processing 5,000 tickets a month, at a 2 percent error rate chosen to sit below what was measured in the field. That is 100 investigations a month, and about $104,000 a year in error-driven cost, before the separate gap between manual and automated processing.
At the 6.0 percent wrong-value rate measured in the field, with reconciliation and the tax provision held fixed, the same model rises to about $266,000, roughly two and a half times. Touching every ticket by hand costs separately: APQC puts the median cost to process one invoice near $21 and best-in-class automated processing near $2 to $3, a gap of roughly $0.5 to 1.1 million a year at the same volume (APQC, Ardent Partners).
Why aviation fuel is so error-prone
The causes are structural, which is why training and double-checking do not remove them.
- Volume against a turnaround clock. Fuel is uplifted on nearly every flight, during the most time-compressed part of ground operations.
- A hostile capture environment. The first record is often made outdoors, at night, in rain or glare, by someone wearing gloves and watching for hazards.
- Hand-offs that multiply transcription. The same uplift can exist as three or four slightly different records at the fueler, the supplier, the airline and the tax filer, and no party owns end-to-end correctness.
- A document that can be wrong while looking right. Gross against net, gallons against litres, temperature correction, a tail one letter off: values that pass a glance and fail the ledger.
Breaking the error chain
The durable fix moves the control from after data entry to before the ledger. The paper describes four capabilities that work together:
- Automated capture replaces transcription. The file, scan or photo is read without anyone re-keying it.
- Validation at the point of entry, against operational logic. Arithmetic, constraint, cross-reference and consistency checks: does the uplift fit the aircraft, does it match the flight schedule, is it a duplicate?
- Exception-only review. People see the tickets that fail a rule, and only those.
- A structured, traceable record by default. Source attached, every decision recorded, ready for finance, tax and audit without reconstruction.
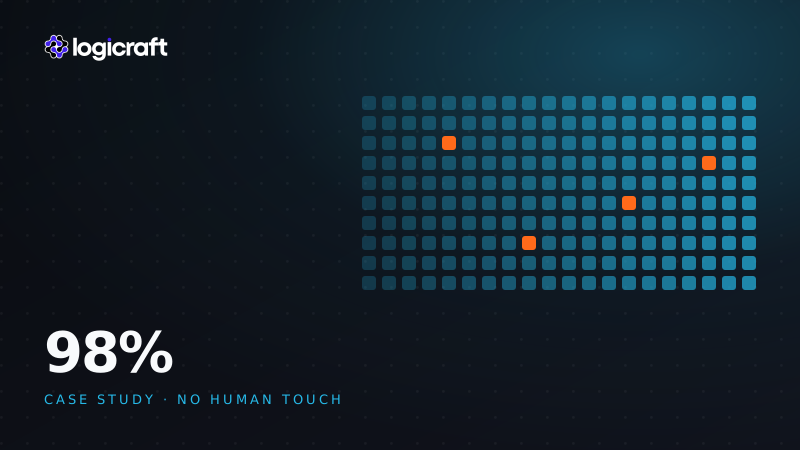
On the case study's tickets, that design let 98.2 percent post with no human touch, and the 348 decisions people did make became rules the system applied from then on.
One question for any vendor
The paper's buyer's checklist is vendor-neutral, and it ends with one question that separates real solutions: when the system reads a value incorrectly, what stops that value from reaching my invoice? If the answer is "a person reviews it", that is faster transcription, not error prevention.
What the paper doesn't claim
The 2025 editions carried industry safety-incident counts and implementation-outcome figures whose primary sources could not be re-confirmed. This edition holds them back rather than restating them, and says so in its evidence register. Nothing in its argument depends on them. The measured figures come from one operation, the managed fuel-data service Logicraft runs for its airline customers.
The complete white paper
41 pages, every figure tagged
The full paper adds the anatomy of a ticket error, the safety and compliance dimensions, the cost model with its sensitivity, implementation, the vendor-neutral buyer's checklist, recommendations for airlines, into-plane agents, FBOs and suppliers, and the evidence register.
Get the white paper